Interpreting Google Search Console Data using Google Data Studio
In integrating Google Search Console and Data Studio, you’ll encounter these two types of data connection: Site Impression and URL impression.

The main difference between the two connectors is that the Site Impression dataset contains the Average Position, site impression, click impression, and site CTR metric, while the URL Impression has the Landing Page dimension, URL impression, URL clicks, and URL CTR. Their common metrics and dimensions are: country, date, device category, and google property.
Google needs to separate these two to describe the performance of the query (site impression) used by the audience and the actual performance of the website (URL impression). We can make sense of these data by creating different levels of strategies: Keyword-centered and page-level.
Keyword-centered Strategy
When searching for a business or store, consumers use either branded or unbranded queries. If your client aims to reach more customers who are not aware of your brand, you can use unbranded queries.
Create your own filter and add the name of your brand with its variations in case users typed it differently. If you are interested in the advance RegEx you can check Mark’s work and Ruben.

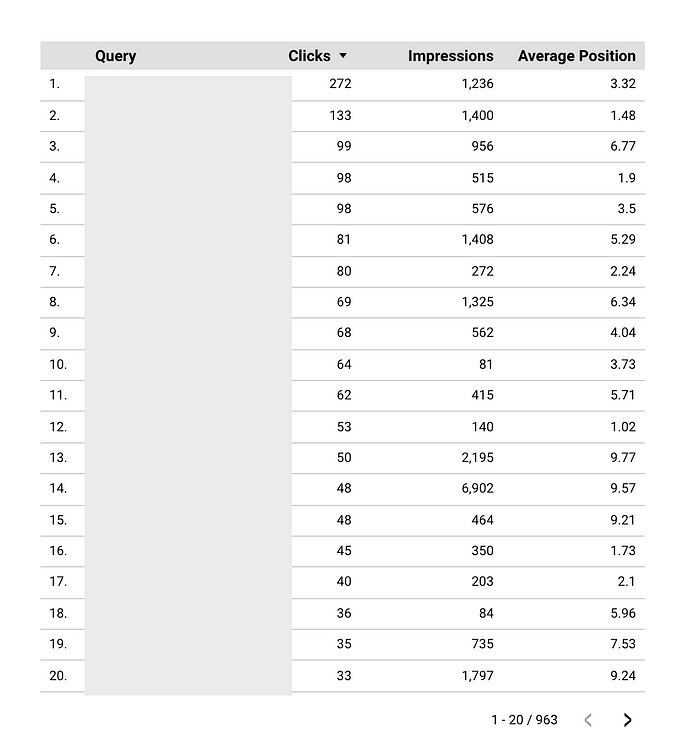
According to Search Console
- Clicks — Count of clicks from a Google search result that landed the user on your property.
- Impressions — How many links to your site a user saw on Google search results. Impressions are counted when the user visits that page of results, even if the result was not scrolled into view. However, if a user views only page 1 but the result is on page 2, the impression is not counted. Google provided an in-depth explanation of how the impression is computed here.
- Average position - The average position of the topmost result from your site. So, for example, if your site has three results at positions 2, 4, and 6, the position reported the highest position which is in this case is 2. If a second query returned results at positions 3, 5, and 9, your average position would be (2 + 3)/2 = 2.5.
The Query Summary is sorted by click. I believe, in this summary, clicks are the most valuable metric from the perspective of Cognitive absorption. It implies that the user is immersed to find your website. Users find those queries to be relevant.
Possible Action Need: Develop content pages related to queries that have an Average Position of less than or equal to 10. Aim to increase that SERP position over the period of time. The higher your page in SERP the higher the chance to be visited.
Using those queries alone will not guarantee to put your page at the topmost part of SERP. One should consider the user intentions and also the implementation of page structured data.
Here are some ideas that will help you understand different levels of user intentions:
- Commercial intent — buy, purchase, cheap, pricing, etc.
- Informational intent — what, when, where, how, restaurant, hotel, flight, news, etc.
- Location intent — near, nearby, from, directions, airport, route, maps, etc.
- Specific intent — sums up the keywords with all three intents described above.
Page-level Strategy
There are many aspects to look at in a webpage: page speed, web-vitals, responsive layout, the hierarchy of information, and clarity of design. Google Search console offers the opportunity to identify pages that has high visibility and clicks.
Possible Action Need: We have two opportunities :
- High Impression Low Clicks: Improve the existing pages that have a high impression by adding relevant content.
- High Impression High Clicks: Improve the pages by adding links to internal or external pages, insert CTA’s or extend the content to cover the related topics and give more visibility to other related pages.

The Landing Pages Summary is sorted by clicks, the higher the clicks, possibly the more relevant the page is. Then there is a new metric called CTR which is by definition Click-through rate, calculated as Clicks / Impressions * 100.
How can you quantify “high CTR”? There is no absolute answer to this and really depends on the industry you are in. In my case, in a spreadsheet, I pulled the top 5 Landing pages and get their average CTR.

In the Landing Pages Summary, I used a CTR threshold of 1.5% instead of 2.11% to identify the healthy and unhealthy CTR of my URLs. In addition to that, I only showed landing pages that have impressions greater than 1000. You can use your domain knowledge to extract and refine the possible actions from your data.
Summary
There are many possible insights we get from Google Search Console. Plan and action varies on the maturity of the website. Different levels of maturity calls for different sets of data to interpret. Each levels has a different challenges. Page-level strategy is an internal opportunity while keyword-level strategy is an external opportunity to improve the website based on Google Search console insights.
These data can be best combined using other tools like Google Analytics and Google Keyword Planner to create a holistic approach to develop content and keyword planning ideas.

