Quantified Self: Clustering data from my Habit Tracker
I’ll be contributing to the Quantified Self movement by sharing the result of this clustering project.
The data exported from Loop — Habit Tracker. This is my friend for several months in my 8 to 5 job before. It helped me record the progress of my routine (what gets measured, gets done).
A habit is an action we do subconsciously or when there is no mental effort to it, otherwise it is a routine. These are the routine that I was trying to develop:
Morning Meditation, Morning readings, Midday Sleep, Out on time, Arthour (personal projects), Before sleep readings, Before sleep meditation.
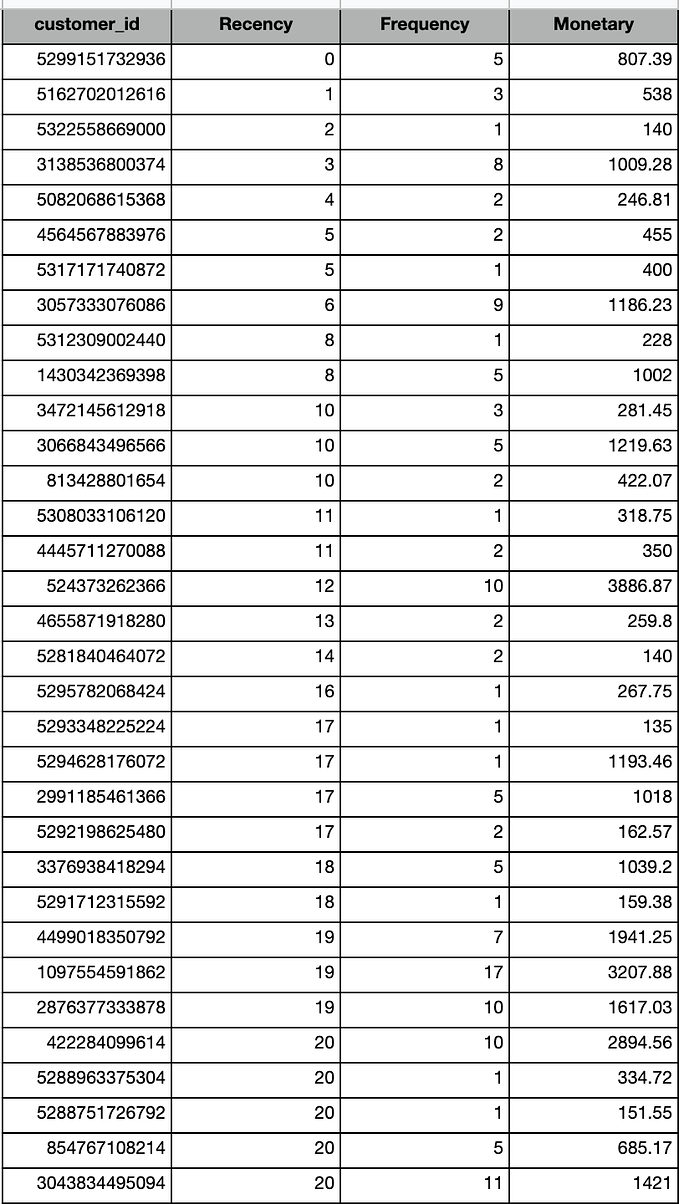
Using the exported data from the app, I have different column and rows. Columns are the habit that I want to track, and rows are the binary values that show whether the routine was fulfilled or not (1-yes , 0-no) .


Pearson Correlation
Using correlation analysis, I discovered the strengths of relationships among my routines. This is worth exploring to establish a connection between these habits.

From the interpretation above we can see that:

- Out on time routine (+0.63) has a moderate to strong positive linear relationship to Before sleep reading routine
- Midday Sleep and Morning Readings routine (+0.73) have a strong positive linear relationship to each other.
- Arthour and Before Sleep routine (+0.77) have a strong positive linear relationship to each other.
- Before sleep meditation and Morning Meditation routine (+0.62) have a strong positive linear relationship to each other.

CLUSTERING
Clustering is an unsupervised learning algorithm that finds clusters or group in a set of data. These groups should have similar properties or features. This method is a common technique for statistical data analysis used in many fields.
K-modes Clustering. According to the documentation
K-modes is used for clustering categorical variables. It defines clusters based on the number of matching categories between data points.This is in contrast to the more well-known k-means algorithm, which clusters numerical data based on Euclidean distance.)
For simplicity, I used 3 number of clusters, this is a subjective judgement about the number of really distinctive clusters described here (I tried more K but it hurts my data).
These are different clusters derived using K-modes. I arbitrarily named my routines as: The Idealist, The Supervisor, The Visionary.

CLUSTER 1: The Idealist
This group has no Out on time and has a plenty of Midday Sleep routine. I remember I stay late at work to read or finish something that needed the next day.

CLUSTER 2: The Supervisor
This cluster has the least number of routines. These days could be tiring.

CLUSTER 3: The Visionary
This cluster has the most number of accomplished routines.

Analyzing such routines helps me understand better how my day looks like back then. From this data, I can design more meaningful routine towards a better day.
Originally published at https://www.linkedin.com.